A user journey map is the visual document that shows every step a real person takes when interacting with your product. Not what you hope they do. Not what your internal testing assumes they do. What they actually do, feel, and struggle with at each point along the way.
Teams that build journey maps before writing code ship products that require fewer post-launch fixes. Teams that skip them often discover their assumptions were wrong six months after launch. This guide covers everything you need to understand, create, and apply user journey maps, including what distinguishes them from customer journey maps, real-world examples across product types, a step-by-step creation process, and a breakdown of every element that belongs on an effective map.
TL;DR
A user journey map is a visual representation of the path a specific user takes to accomplish a specific goal within your product or service. It captures every action they perform, every touchpoint they interact with, and every emotion they experience along the way.
The map is always tied to a persona and a scenario. A generic user going through a generic task produces a map that reveals nothing. A freelance designer trying to publish a client project at 11pm on a deadline produces a map that reveals exactly where the product fails real people under real conditions.
User journey maps are used by UX designers, product managers, and cross-functional product teams to build shared understanding of what users actually experience, not what the team assumes they experience. The gap between those two things is where most UX failures live.
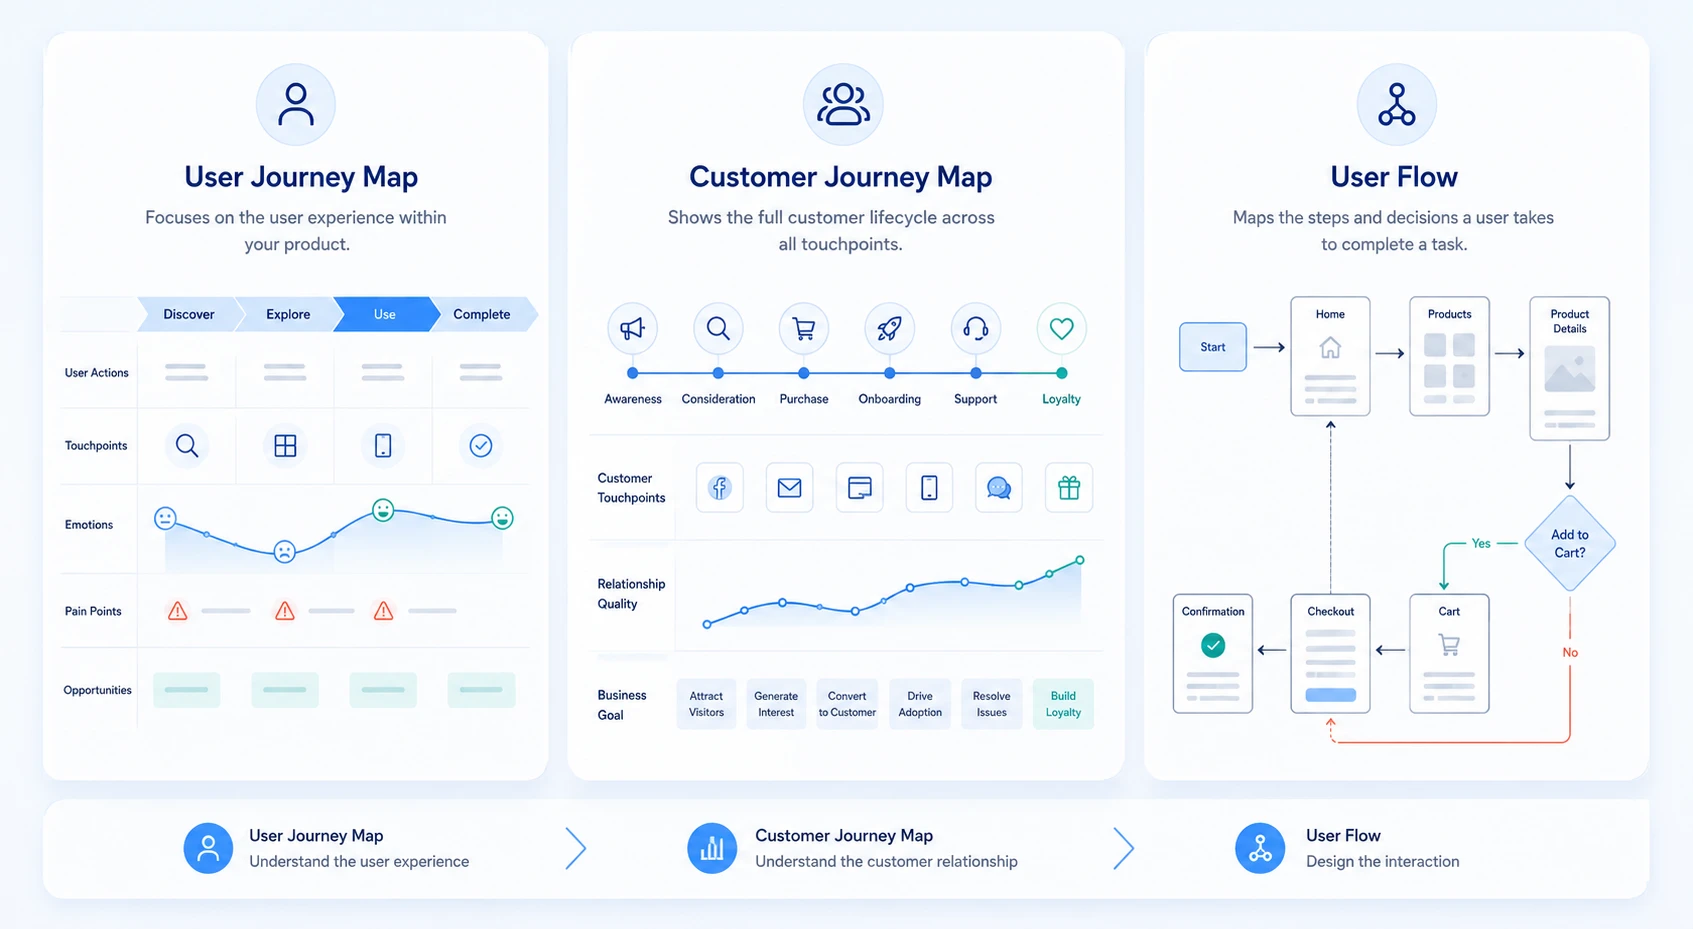
These three tools are frequently confused. Each serves a distinct purpose.
A user journey map shows what happens when a specific user tries to accomplish a goal inside your product. A customer journey map zooms out to the full relationship: how someone discovers you, buys from you, gets support, and either stays or churns. A user flow is a technical document showing which screen leads to which other screen. User flows specify the design. Journey maps inform it.
Not all journey maps serve the same purpose. Choosing the right type before you start saves significant time.
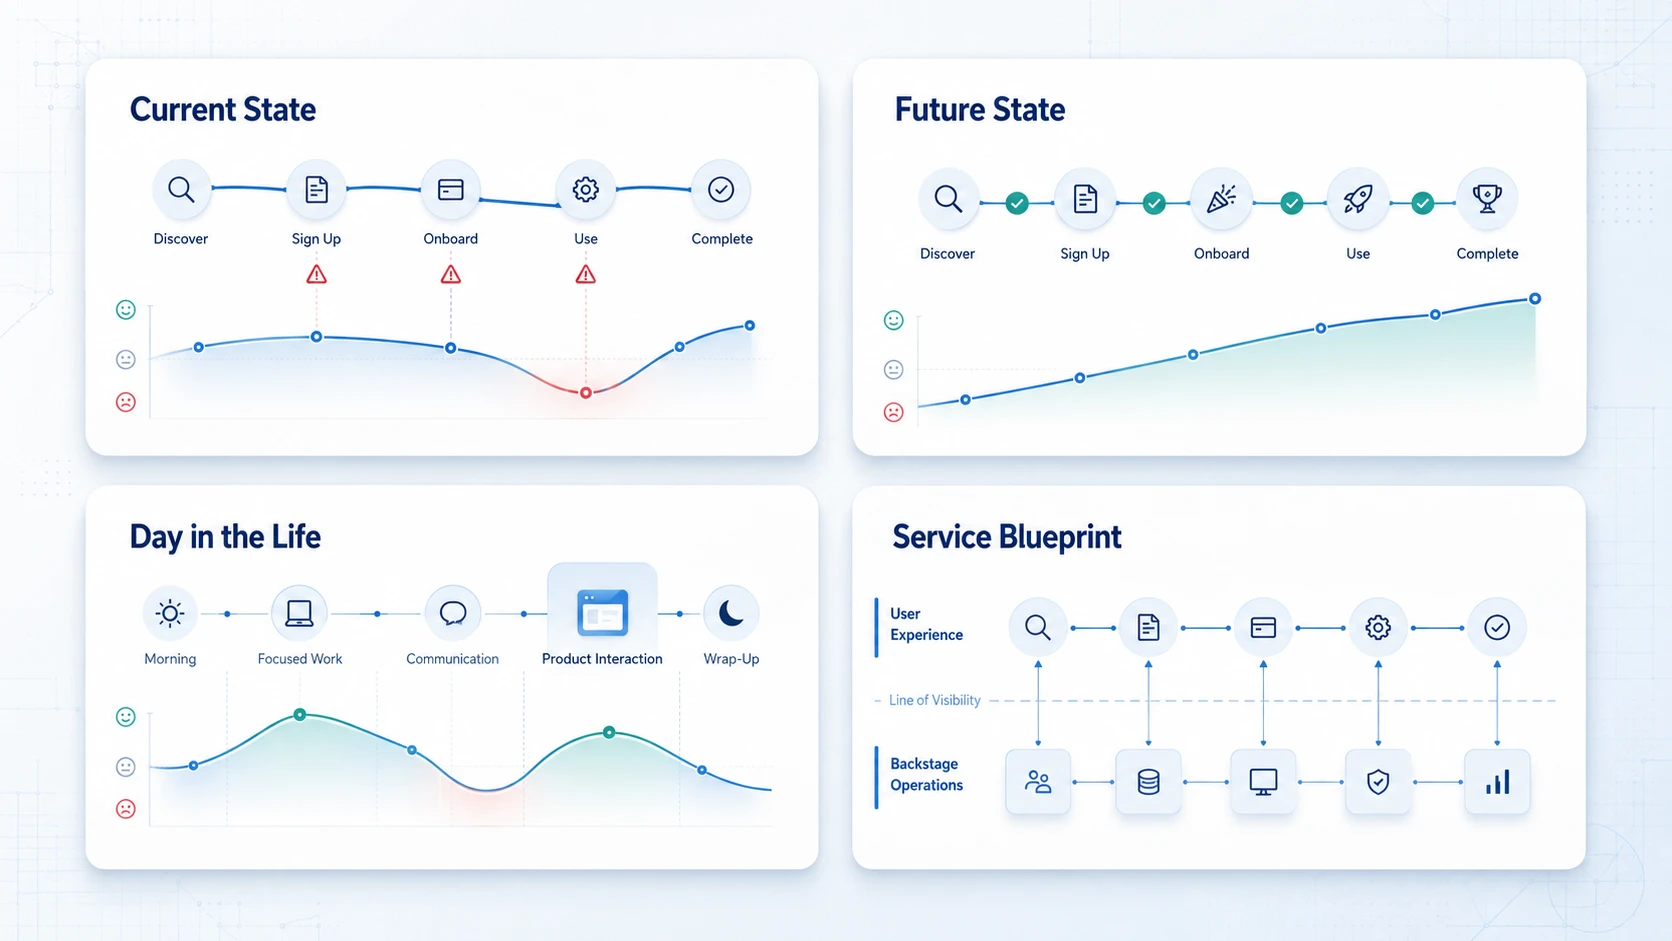
Service blueprints sit behind journey maps and show what the organization does internally at each stage of the user's experience. They are useful for aligning operational teams with the user-facing experience, especially in complex service organizations.
A well-constructed user journey map contains seven core elements. Each one adds a specific type of insight
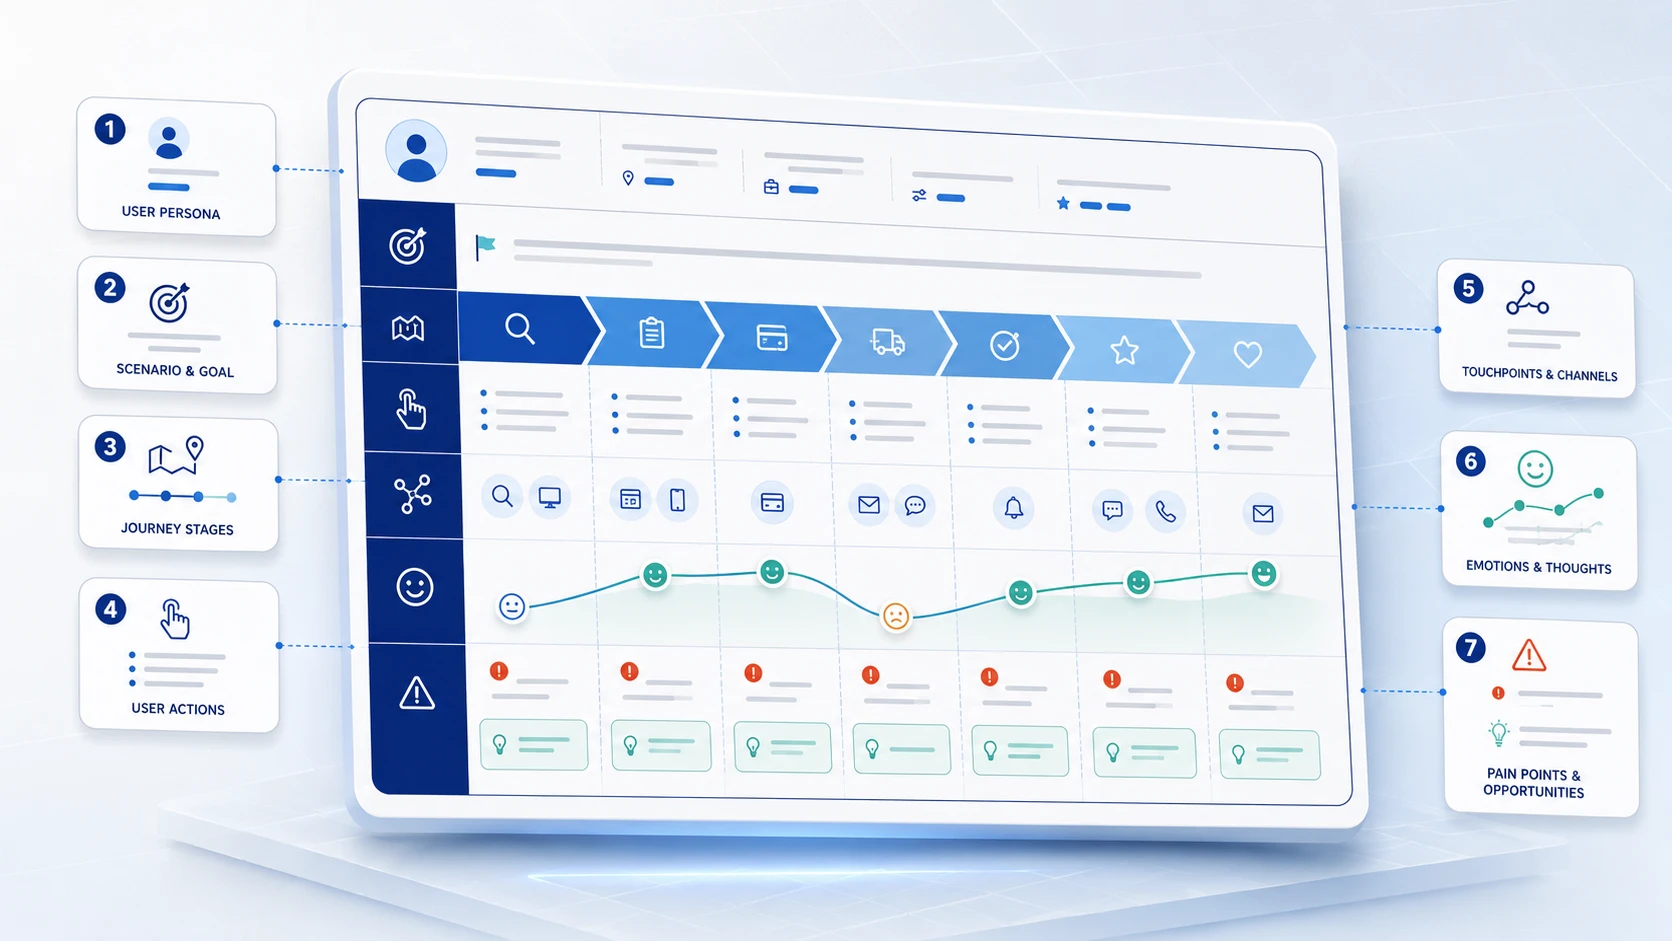
The specific fictional character representing a real user segment. The persona includes goals, behaviors, technical comfort level, and the context in which they use your product. Without a specific persona, the map becomes a generic exercise that surfaces generic insights.
The exact situation the persona is trying to navigate and what success looks like. A first-time SaaS user trying to connect their data source within 10 minutes of signing up is a scenario. User uses the product is not. Specificity determines the quality of what the map surfaces.
The high-level phases the user moves through. For a SaaS product: Awareness, Sign Up, Onboarding, First Use, Regular Use. For e-commerce: Discovery, Evaluation, Decision, Checkout, Post-Purchase. The stages should reflect the user's experience, not your internal process steps.
The specific things the user does at each stage. Visits the pricing page. Searches for documentation. Tries to upload a file. Abandons the checkout. Actions are observable and form the backbone of the map's narrative.
Every interface or interaction point where the user connects with your product or brand: the landing page, onboarding email, in-app tooltip, help center article, customer support chat. Mapping touchpoints reveals where the experience is fragmented or inconsistent.
The user's emotional state at each stage, typically visualized as an arc or curve showing highs and lows across the journey. Emotions are usually captured through user research and are the element most teams underinvest in. A user who completes a task but feels frustrated while doing it will not recommend your product.
The friction moments where users struggle, hesitate, or drop off, and the corresponding opportunities to improve. Pain points turn the map from a documentation exercise into a product roadmap. Every pain point is a direct input into the design backlog.
Seeing how a journey map works in practice is more useful than reading another definition. Here are three examples across different product types.
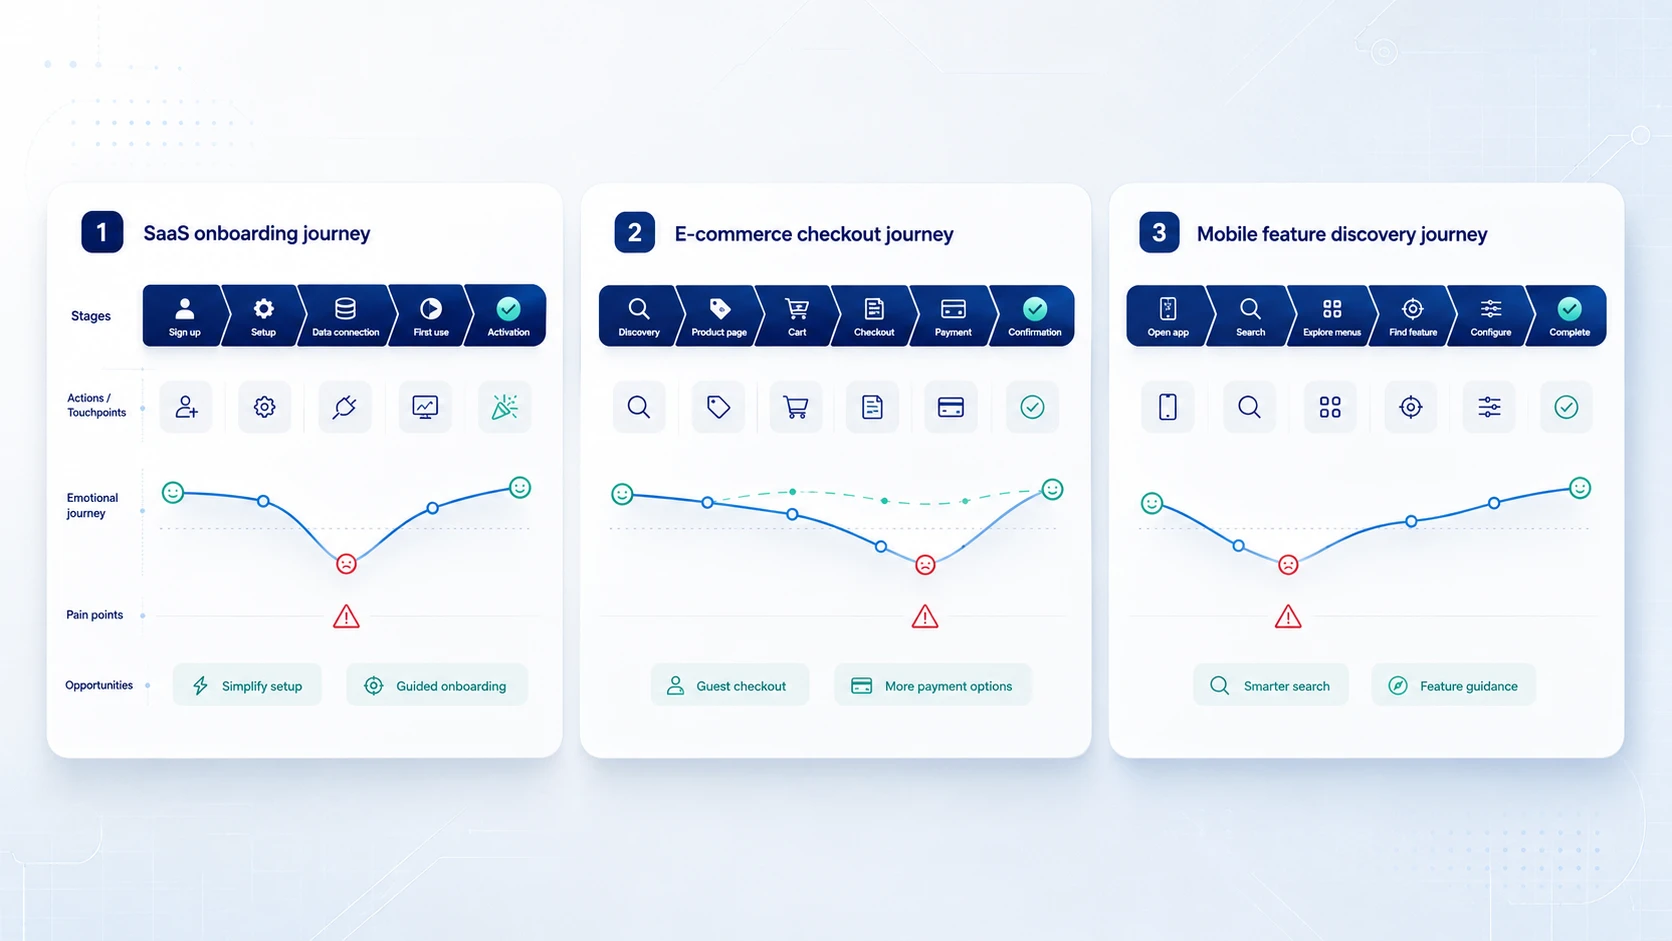
Persona: Maya, a marketing manager at a 50-person startup who signed up for a marketing analytics tool after a referral.
Scenario: Complete the initial setup and connect her first data source within her first session.
The journey map reveals: Maya hits a workspace type selection screen with five options and no guidance. She guesses wrong and later discovers she cannot change it without contacting support. When she tries to connect Google Analytics, she encounters a permissions error written in technical language with no plain-language explanation or fallback path. She closes the tab and does not return for three days.
Pain points surfaced: Confusing workspace type selection, vague connector permission error messages, no fallback for users who hit a technical blocker during onboarding.
Opportunities: Contextual tooltips on workspace type options, plain-language error rewrite with a share-with-your-admin link, and an alternative onboarding path that lets users explore the product before completing the data connection.
Persona: James, 34, purchasing a birthday gift on a mobile device during his lunch break.
Scenario: Find a product and complete checkout in under 10 minutes.
The journey map reveals: James cannot find size information on the product page. He is required to create an account before checking out. He chooses guest checkout but does not receive a confirmation email for 15 minutes.
Opportunities: Add size guides to product pages, make guest checkout the primary path, and trigger confirmation emails within 60 seconds.
Persona: Priya, a product manager trying to set up recurring task assignments for her team without consulting documentation.
Scenario: Find and configure the recurring tasks feature in a project management app.
The journey map reveals: Priya searches recurring in the search bar and gets no results because the feature is called scheduled tasks. She explores three wrong menus. The configuration UI requires 11 clicks for a common use case. She completes the task but rates the experience as frustrating in a follow-up survey.
Opportunities: Add recurring as a search alias, surface the feature in the task creation flow, and reduce the configuration steps.
A user journey map template is organized as a table where columns are journey stages and rows are the elements you are tracking. Here is the standard structure.
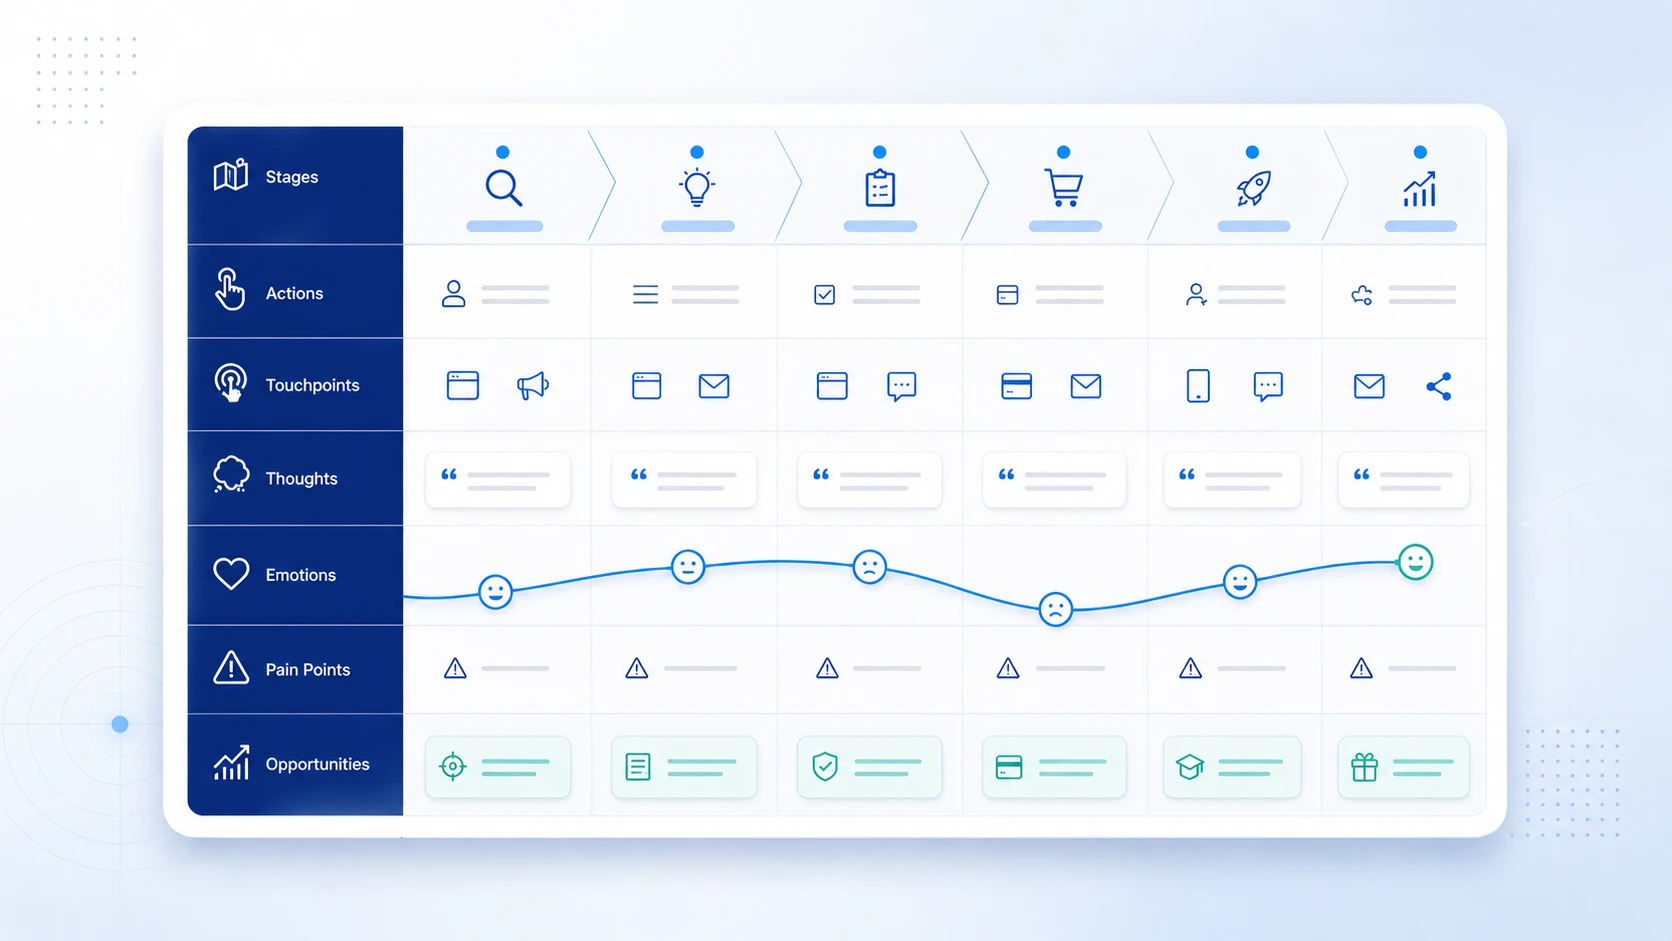
Most digital tools (Miro, FigJam, UXPressia) have built-in templates with this structure. Starting from a template is faster than building from scratch, but the value comes from the research that fills it, not the template itself.
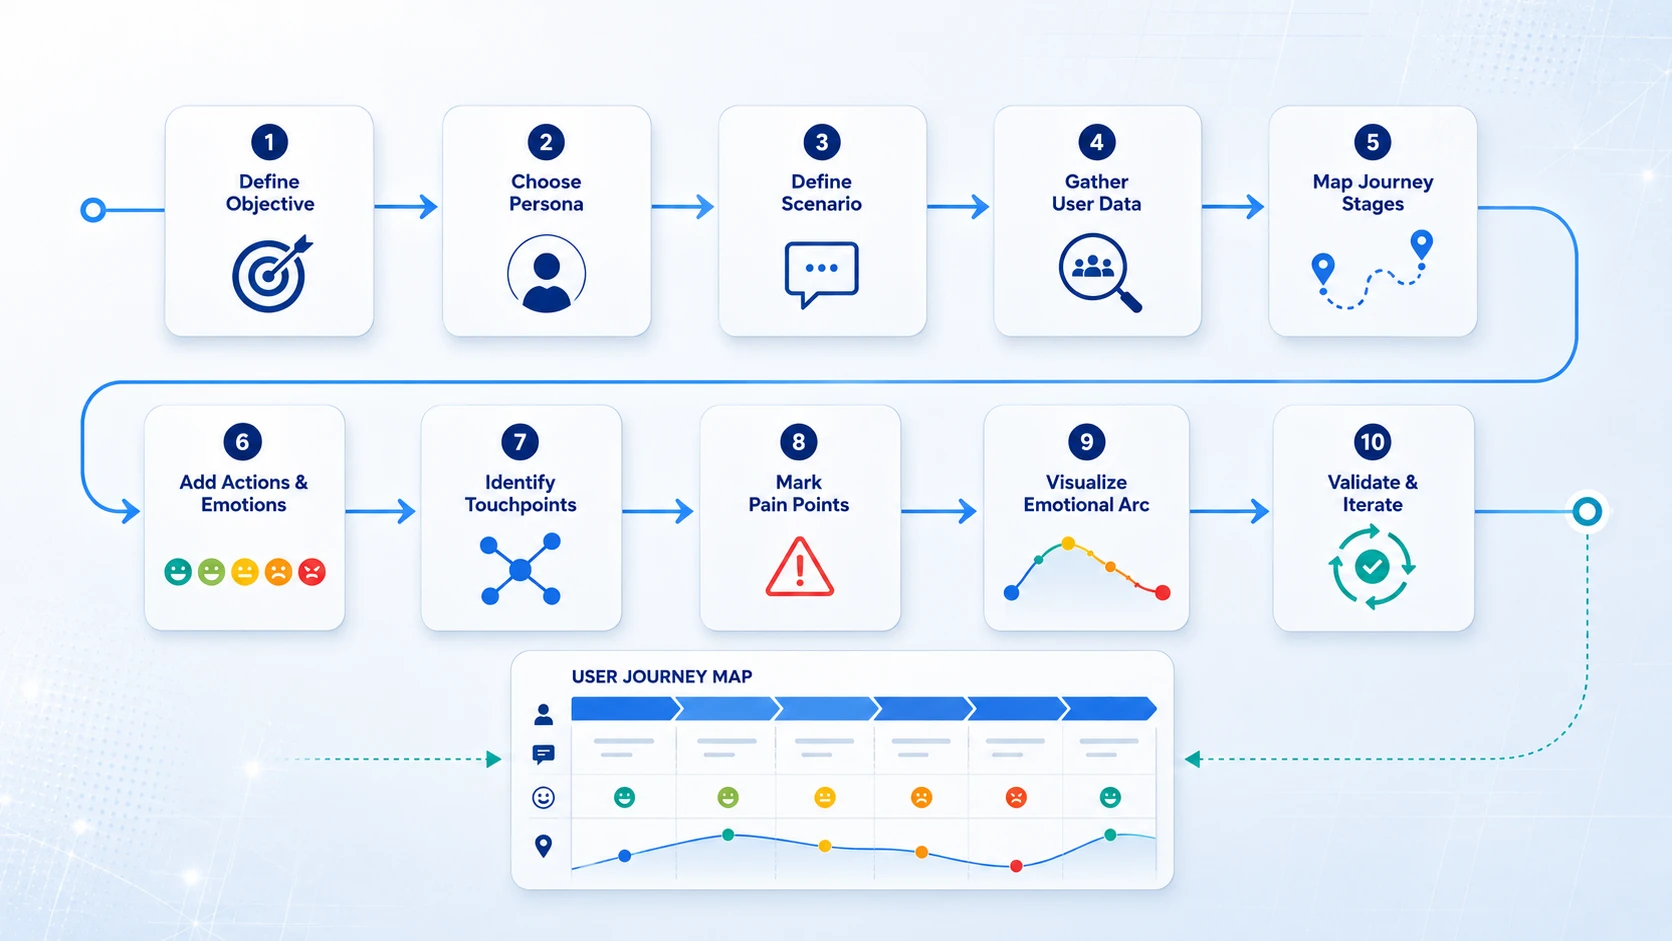
1. Define the objective: Decide what specific question the map needs to answer. Are you diagnosing why free trial users do not convert? Improving a specific onboarding flow? A map with a clear objective produces actionable insights. A map created as a general exercise produces general observations.
2. Choose your persona: Select or create a specific persona for this map. If you have multiple user types, create separate maps. Combining personas in one map obscures the differences between user experiences that are often where the most valuable insights live.
3. Define the scenario and scope" Set the specific task and time frame the map will cover. A new user completing setup during their first session is a valid scope. How users use the product is not. Narrow scope produces sharp insight.
4. Gather real user data: Conduct user interviews, run usability tests, review session recordings, and analyze behavioral analytics. Assumptions fill the map faster but make it inaccurate. Data takes more time and produces maps teams can actually act on.
5. Map the journey stages: Lay out the phases the user moves through from start to goal. Use the user's perspective, not your internal process. The stages should match how users naturally chunk the experience.
6. Actions, thoughts, and emotions for each stage: Fill in what the user does, thinks, and feels at each stage. Use direct user quotes from research in the thoughts row. They are more persuasive to stakeholders than paraphrased summaries.
7. Identify touchpoints and channels: Document every point where the user interacts with your product, brand, or team. Touchpoints show where the experience is fragmented or inconsistent.
8. Mark pain points and opportunities: Annotate the moments where users struggle and tag each pain point with the opportunity it represents. This is the most directly actionable row on the map.
9. Visualize the emotional arc: Plot the user's emotional state as a curve across the journey. The visual shape of the arc, where it rises, falls, and crashes, is often the most persuasive element for non-UX stakeholders in design reviews.
10. Validate and iterate: Share the map with users who match the persona. Ask them to identify where the map feels accurate and where it misses something. Then use the map to drive prioritization decisions.
For teams that are new to journey mapping, FigJam or Miro are the fastest to start with. Both have free templates and require no setup. UXPressia and Smaply are worth the investment for teams that do regular journey mapping work and need built-in persona management and emotional arc tracking.
For product teams without dedicated UX research capacity, outsourcing journey mapping to a UX agency can compress a multi-week research and synthesis process into a focused engagement.
A professional user journey mapping engagement typically includes recruiting and conducting user interviews, synthesizing behavioral data with qualitative research, building current state journey maps for key user segments, identifying the highest-priority pain points and opportunities, and presenting findings in a format the product team can act on directly.
Musemind conducts user journey mapping as part of UX research engagements for SaaS products, MVPs, and digital platforms. The output connects directly to the design and development process: mapped pain points feed the design backlog, emotional arc insights inform information architecture decisions, and touchpoint analysis shapes system design.
A user journey map is a visual document that captures every step, action, thought, emotion, and pain point a specific user experiences while trying to accomplish a specific goal in your product or service. It is tied to a persona and a scenario, not a generic user doing a generic task.
A user journey map focuses on how a specific user interacts with a product to accomplish a goal. It covers actions, touchpoints, emotions, and pain points within the product experience. A customer journey map covers the broader business relationship from initial awareness through purchase, support, and long-term loyalty. User journey maps are primarily used by UX and product teams. Customer journey maps are used by marketing and customer experience teams.
A user journey map is qualitative and research-based. It captures what users think, feel, and struggle with. A user flow is a technical document showing the screen-to-screen navigation path within a product. User flows specify design logic. Journey maps inform it.
The seven core elements are: user persona, scenario and goal, journey stages, user actions, touchpoints and channels, emotions and thoughts, and pain points with corresponding opportunities. Removing any of these elements reduces the map's ability to surface actionable insights.
Current state maps document how users experience your product today. Future state maps visualize the ideal experience you are designing toward. Day-in-the-life maps zoom out to show the user's broader context and routine. Service blueprints show the organizational processes that support the user-facing experience.
Define the objective, select a persona, define the scenario and scope, gather user research data, map journey stages, add actions and emotions for each stage, identify touchpoints, mark pain points and opportunities, visualize the emotional arc, then validate the map with real users and use it to drive product decisions.
Effective maps are grounded in real user research rather than team assumptions, tied to a specific persona and scenario, visualize the emotional arc clearly, connect pain points directly to design opportunities, and are shared widely enough to create cross-team alignment.
Create one when diagnosing why users are dropping off at a specific stage, before redesigning an existing product or feature, when building a new product from scratch, when onboarding a new team member to the user experience context, or when you need to align stakeholders on the current state of the user experience.
Yes. B2B journey maps often involve multiple personas (the evaluator, the buyer, the end user, the administrator) and longer decision timelines. Mapping each distinct role separately and identifying how their journeys intersect is especially useful for B2B SaaS products.
The emotional arc is a visualization of the user's emotional state plotted as a curve across the journey stages. Peaks show moments of delight or relief. Valleys show moments of frustration, confusion, or abandonment risk. The shape of the arc is often the most persuasive element in a journey map for stakeholders outside of UX.


An Experience Design Agency focusing on building functional, simple, human-centered digital products for future.